What is a Pivot Table
A Pivot Table is a visualisation tool that can aggregate data from a data source (historically a single Excel data table) and display that data in a way that helps the reader make sense of the data. Let’s look at an example
Source Data Table
Here are a few rows of a simple Excel Table (ie a data source). Note there are more rows in this table that are not shown here to save space. This is my data source.
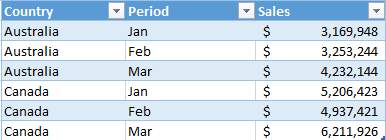
The trouble with source data like this is it is hard to find insights. Eg which country has the highest sales this year? It is hard to read typically because there is so much data and it is at a level of detail that makes it hard to consume. So we need a way to aggregate, summarise and display the data so we can make sense of it.
Pivot Table
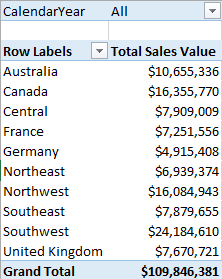
Here is a Pivot Table that uses the above source data. The Pivot Table is used to summarise and present the data to the user in a way that makes sense.
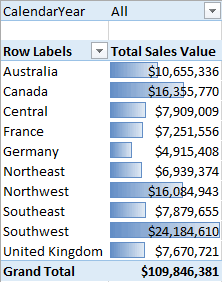
Further, you can use inbuilt Excel visualisation tools to make the data even easier to read, as can be seen below.
In fact, Microsoft Excel is the world’s most commonly used tool for visualising data. It has had years of development and is a very mature, flexible and stable product that EVERYONE knows how to use. Excel is a GREAT TOOL for visualisation.
So what’s the problem?
Well, there are quite a few problems actually.
1. Historically Pivot Tables only allow the user to use a single source data table. That is OK for very simple data sets but it very quickly becomes a limitation. It is very common for source data to be split into multiple tables, particularly if you are getting the data from a database program. If the data are split in different tables, then it has been historically hard to use in a Pivot Table. In addition (and more recently with the advent of Cloud computing and social networking) people are sourcing data in different locations and want to compare these data as one. The Excel user then needs to use VLOOKUP (or similar) to bring the data into a single table before it is possible to create a Pivot Table. This very quickly becomes a problem for performance, setup effort and maintenance effort.
2. Excel can only store 1 million rows of data, so forget trying to use Pivot Tables on really large data sets. (Actually, you can connect standard Pivot Tables to an Analysis Services Data Cube, but that requires expensive IT infrastructure and effort to build and maintain, so that is not considered viable for the average Excel user).
3. Well before you hit the 1 million row limit, Excel will start performing very poorly, particularly if you have lots of VLOOKUPs etc. Excel it is not optimised for large database crunching work.
4. Pivot tables are very good at aggregating data that exist in a suitable raw form in the underlying table but are terrible in reporting on anything else that could be derived from the source data. In the example above the Pivot Table is just adding up all the Sales per country – easy. But what if you want to know the % change in sales in Feb this year vs Feb last year? Or which country has the highest profit margin. Although you can’t see all my source data, the data does actually have cost and sell, so it has all the data needed to complete this calculation. However it is one thing to have cost and sell in your data source, but it is another thing altogether to be able to create a Margin % figure and report on it in a Pivot Table. Standard Pivot Tables are terrible at creating new ‘derived’ insights from raw underlying data.
So in summary, Pivot Tables are great for visualisation as long as your data is optimised in a way to leverage the power of Pivot Tables.
So What is Power Pivot?
Well as you may have guessed by now, Power Pivot is a tool that allows you to prepare your data in a way that Pivot Tables can use. Power Pivot is actually a data modelling tool. Power Pivot allows you to do the following
1. Take data from one or more sources and combine it together into a single data source (this is called the data model).
2. Enhance the underlying data so that you can create new derived concepts out of the data. So if you have Sales $ and Cost $ in your source data, you can create Margin $ and Margin % and make these new concepts available to a Pivot Table.
3. The new concepts you build in Power Pivot are infinitely reusable in your Pivot Tables. In traditional Excel you need to create formulae in individual cells by pointing to other source cells. If you want to reuse a formula you have created on another Sheet that is not 100% identical to the first sheet, then you effectively have to rewrite the formula. This is not the case with Power Pivot. You write the formula once in the data model and then it can be reused over and over in as many Pivot Tables as you like.
4. Power Pivot compresses the source data and stores it as a database within the Excel workbook. This means that you can store 10s (even 100s) of millions of rows of data directly in an Excel workbook in a highly compressed and performant way, and distribute it to other people without them needed to have access to the source database.
So Power Pivot is not “Pivot Tables on Steroids” because Power Pivot does not change the functionality of Pivot Tables. What Power Pivot does is change the source data so that you can use data that could not previously be used, and you can get more out of data that you previously used inside of a Pivot Table. So Power Pivot is actually your source data on steroids.
What’s More, Power Pivot has the Following Great Features & Benefits
1. Any competent Excel user can learn Power Pivot. This makes complex data modelling that was previously only possible by engaging slow and expensive IT resources within reach of the average business analyst.
2. Because of point 1, it is possible for business users to rapidly prototype and build business reporting and analysis tools in hours/days of work that would have previously taken months/years by engaging in a BI project. This makes an analysis that was previously impracticable and impossible to justify within arm’s reach of an Excel user.
3. Power Pivot was developed by the Microsoft SQL Server Analysis Services team and it has been built with the Excel user in mind as well as the SQL Server user. Any data model built in Excel by an Excel user can be quickly and easily migrated into SQL Server Analysis Services Tabular (SQL Server 2012+) and enhanced and/or operated as a robust IT solution. There is no need to start again from scratch if you want to take your Excel solution and make it an Enterprise solution.
Source: Excelerator BI